| Mohsen Shahandashti, Ph.D., P.E., University of Texas, Arlington, Texas, United States | Baabak Ashuri, Ph.D., and Mehdi Tavakolan, Ph.D., Georgia Institute of Technology, Atlanta, Georgia, United States |
| Transportation agencies and most notably State Departments of Transportation (State DOTs) sponsor various research projects to enhance the state of transportation in a wide range of impact areas, such as safety, environmental sustainability, and congestion reduction. Determining the value of transportation research projects is a critical step towards promoting high value research projects and assuring that research funds are not misappropriated. Although a variety of methods and measures have been proposed to determine the value of transportation research, there has not been a study to synthesize these methods and measures and exemplify their actual applications under various impact areas. The overall objective of this paper is to synthesize existing methods and measures for determining the value of transportation research. Through data gathering and analysis, it is found out that most State DOTs (84%) that responded to the survey have future plans to quantify the value of research projects. However, the lack of knowledge about existing methods and measures is a significant barrier for assessing the benefits of research projects across various benefit areas. The results of content analysis conducted on the documents that represent the state of practice in determining the value of research showed that, regardless of the difference in benefit areas, all the managers of transportation research agencies strive to answer 2 critical questions when it comes to determine the value of research: what method and what measure could be used to determine the value of research? This research determines how these critical questions are answered in the current state of practice. The results were presented to research program managers of transportation agencies for validation. These subject matter experts rated the results highly useful to their current practices. The major contribution of this paper is to identify and exemplify various methods and measures that have been successfully used for determining the value of transportation research in a variety of impact areas.
Keywords: Value of Research, Transportation, Methods, Measures. |
|
Introduction
Transportation agencies and most notably State Departments of Transportation (State DOTs) sponsor various transportation research projects to improve transportation system features, such as safety, environmental sustainability, and congestion reduction. The 2015 actual U.S. federal budget for research and development in transportation was $1,363 million (NSF 2017). The 2016 preliminary and 2017 proposed U.S. federal budgets for research and development in transportation are $1,369 million and 1,735 million, respectively (NSF 2017). Transportation research projects are aimed at fostering innovation in different areas, such as safety, environmental sustainability, and congestion reduction. Determining the value of transportation research projects is a critical step to effectively promote high value research projects and to assure that funds are not misappropriated. Despite the great importance of determining the value of transportation research projects, transportation agencies do not always follow a systematic approach to quantify the value of their research projects. Determining the value of transportation research projects has been challenging for transportation agencies because a variety of different methods and measures have been proposed to determine the value of research across various benefit areas. However, there has not been a single study to synthesize these existing methods and measures and provide examples on how the existing methods and measures have been used to determine value of research.
Various methods have been proposed by researchers for determining the value of transportation research. Cost/benefit evaluation method is found to be the most common approach proposed for determining value of research (Anderson 2010; Worel et al. 2008; Ellis et al. 2003; Tavakoli and Collyard 1991; Ardis 1988). Methods other than cost/benefit analysis, such as multi-objective analysis technique (Tavakoli and Collyard 1991) and matrix approach (Concas et al. 2002) have also been proposed for determining the value of transportation research. The proposed methods have not been systematically utilized by transportation agencies to determine the value of their research projects for a variety of reasons, such as complexity of the methods (i.e., the implementation of the methods is not intuitive), lack of awareness about the alternative methods, absence of implementation history, and data scarcity for implementation.
In addition to the need to select proper methods, appropriate measures are required to quantify the benefits of research. Krugler et al. (2006) recognized this need in a study sponsored by the National Cooperative Highway Research Program (NCHRP), and proposed a list of research-related performance measures. The results showed that State DOTs have not widely adopted the proposed research-related performance measures for a variety of reasons. The top reasons for low adoption are practical challenges that make the proposed measures not suitable for determining the value of research in some projects, and lack of awareness about the measures. Several transportation agencies, such as California Department of Transportation (Caltrans), prefer to create their own research-related performance measures that are uniquely customized to capture the specific needs of these agencies. These reasons highlight the importance of identifying existing methods and measures that have actually been used for determining the value of transportation research under various impact areas to enhance awareness about the state of practice.
Recently, transportation agencies have published documents to highlight high value research projects. For example, the Value of Research Task Force of the American Association of State Highway and Transportation Officials (AASHTO) Research Advisory Committee (RAC) compiles high value research projects from across the nation. The annual compilations of high value research projects, titled “Research Impacts: Better – Cheaper – Faster,” are available from 2009 to present. Transportation Research Board (TRB) also publishes documents titled “Research Pays Off.” These TRB documents are prepared to address the need to continually demonstrate the benefits of research in order to enable decision makers to understand the potential for long-term rewards and properly assess the value of research. Although these documents provide excellent examples for determining value of research, there is not a single study to synthesize these examples and provide a holistic view.
Transportation research projects can have impact on various areas. According to the literature (TRB Research Pays off 2015; MAP-21 2012; Ellis et al. 2003; Tavakoli and Collyard 1991), transportation research projects provide benefits in several impact areas, including safety, environmental sustainability, management and policy, infrastructure condition, traffic and congestion reduction, quality of life, freight movement and economic vitality, customer satisfaction, system reliability, engineering design improvement, increased service life, improved productivity and work efficiency, reduced user cost, reduced administrative costs, reduced construction, operations and maintenance (O&M) cost, and materials and pavements. There is a research need to identify the existing methods and measures for demonstrating the true value of research projects in these impact areas. The overall objective of this paper is to synthesize existing methods and measures for determining the value of transportation research in various areas of research impact. To achieve this objective, the following research methodology is utilized.
Methodology
The research methodology consists of the following steps:
- Conducting a nationwide survey of research project managers in several transportation agencies.
- Performing follow-up interviews with the selected subject matter experts in determining the value of transportation research projects.
- Analyzing the content of the documents recommended by the research managers for representing the state of practice in transportation research valuation.
- Validating the results. The survey was distributed among representatives from 50 State DOTs, the District of Columbia, the Federal Highway Administration (FHWA), and the Transportation Research Board (TRB) via email. The survey findings were analyzed and presented in the following sections.
The results of this research were presented to the members of the Southeast Transportation Consortium (STC) for validation during the annual summer meeting of the consortium. The twelve members of this consortium collectively offer a broad range of talent and expertise in managing several research programs in transportation agencies in the Southeast of the United States.
Results
The survey was distributed among representatives from 50 State DOTs, the District of Columbia, the Federal Highway Administration (FHWA), and the Transportation Research Board (TRB) via email. Representatives from 20 State DOTs (Alaska, California, Colorado, Florida, Georgia, Illinois, Iowa, Louisiana, Maine, Maryland, Minnesota, Mississippi, Montana, North Carolina, Ohio, Pennsylvania, South Carolina, Texas, Utah, and West Virginia DOTs), FHWA, and TRB replied to the survey. The response rate was approximately 40%. This participation rate compares favorably with similar data collection efforts (Hamilton 2009; Nulty 2008).
Table 1 summarizes the main statements expressed by survey respondents. The results show that most respondents (80%) have not conducted any study regarding the value of research. Although most respondents (84%) have future/present plans to quantify the value of research projects, the lack of knowledge about existing methods and measures is a significant barrier for assessing the benefits of research projects across various benefit areas. The respondents commented that collection and distribution of good evaluation examples are extremely helpful. This result confirms our initial research motivation that identifying the existing methods and measures is critically important for determining the value of research.
| Table 1: Summary of the main statements expressed by respondents to the survey | |
| Expressions | Percentage of Respondents |
| Tried to determine the benefits and the values of the research projects | 68% |
| Used implementation plans to evaluate the benefits of the research projects | 12% |
| Tried to use RPM (Research Performance Measures) for evaluating and documenting the benefits of their research projects | 16% |
| Believed that RPM was a valuable tool | 12% |
| Believed that RPM was not a valuable tool | 4% |
| Believed in potential applicability and utilization of the proposed RPM metrics | 76% |
| Believed in the lack of applicability of the RPM metrics | 20% |
| Noted that they have future plans to quantify research benefits | 84% |
| Showed interest in using RPM as the future plan | 24% |
| Not conducted any study regarding the value of research | 80% |
The documents representing state of practice in determining the value of transportation research were collected by following up with the individuals who replied to the survey. Members of the American Association of State Highway and Transportation Officials (AASHTO) Research Advisory Committee (RAC) were also contacted via email to provide documents that represent the state of best practice in determining the value of research in several areas that a transportation research project can have an impact on. A total of 42 documents were provided to the research team following the completion of the survey. The collected documents show best examples of valuation of DOT research projects in different areas of impact. These documents were reviewed and their contents were analyzed. The results of content analysis showed that regardless of the difference in the benefit areas, all the managers of transportation research agencies answer two common critical questions when it comes to determine value of research. These two critical questions are:
- What method could be used to determine the value of research?
- What measure could be used to determine the value of research?
Content analysis helped us identify and analyze the methods and measures used in these documents to articulate the value of research. The following sections present the results of content analysis and show how the transportation agencies and researchers answer these two common critical questions. Table 2 presents these 42 research projects.
| Table 2: Examples of determining value of research | ||
| ID | Project Title | Sponsor |
| 1 | An Evaluation of the Benefits of the Alabama Service and Assistance Patrol | Alabama DOT |
| 2 | Systems Engineering Guidebook by DOT | California DOT |
| 3 | Mobile Work Zone Barrier | California DOT |
| 4 | A Study of Bus Propulsion Technologies Applicable in Connecticut and Demonstration and Evaluation of Hybrid Diesel-Electric Transit | Connecticut DOT |
| 5 | Rural Road Low Cost Safety Improvements | FHWA |
| 6 | Evaluation of Pollution Levels Due to the Use of Consumer Fertilizers under Florida Conditions | Florida DOT |
| 7 | Operational and Safety Impacts of Restriping Inside Lanes of Urbane multilane Curbed Roadways to 11 Feet or Less to Create Wider Outside Curb Lanes for Bicyclists | Florida DOT |
| 8 | Development and Evaluation of Devices Designed to Minimize Deer-vehicle Collisions (Phase II) | Georgia DOT |
| 9 | Assessment of the Impact of Future External Factors on Road Revenues | Georgia DOT |
| 10 | Improving Safety in High-Speed Work Zones: A Super 70 Study | Indiana DOT |
| 11 | Winter Operations Geographic Positioning Systems and Automatic Vehicle Location | Iowa DOT |
| 12 | Calibration of Resistance Factors Needed in the LRFD Design of Driven Piles and Drilled Shafts | Louisiana DOT |
| 13 | Evaluation of Ternary Cementitous Combinations | Louisiana DOT |
| 14 | Development and Performance Assessment of an FRP Strengthened Balsa-Wood Bridge Deck for Accelerated Construction | Louisiana DOT |
| 15 | Evaluation of Surface Resistivity Measurements as an Alternative to the Rapid Chloride Permeability Test for Quality Assurance and Acceptance | Louisiana DOT |
| 16 | Accelerated Loading Evaluation of Subbase Layers in Pavement Performance | Louisiana DOT |
| 17 | Evaluation of Surface Resistivity Measurements as an Alternative to the Rapid Chloride Permeability Test for Quality Assurance and Acceptance | Louisiana DOT |
| 18 | Mechanistic Flexible Pavement Overlay Design Program | Louisiana DOT |
| 19 | Cost Effective Prevention of Reflective Cracking of Composite Pavement | Louisiana DOT |
| 20 | Implementation of Rolling Wheel Deflectometer (RWD) in PMS and Pavement Preservation | Louisiana DOT |
| 21 | A Sensor Network System for the Health Monitoring of the Parkview Bridge Deck | Michigan DOT |
| 22 | Economic benefits resulting from road research performed at MnROAD | Minnesota DOT |
| 23 | MsDOT Implementation Plan for GPS Technology in Planning, Design, and Construction Delivery | Mississippi DOT |
| 24 | Evaluation of an Adaptive Traffic Signal System: Route 291 in Lee’s Summit, Missouri | Missouri DOT |
| 25 | Diverging Diamond Interchange Performance Evaluation (I-44 & Route 13) and Diverging Diamond Lessons Learned document | Missouri DOT |
| 26 | Evaluation of Life Expectancy of LED Traffic Signals and Development of a Replacement Schedule | Missouri DOT |
| 27 | Placement of Detection Loops on High Speed Approaches to Traffic Signals | North Carolina DOT |
| 28 | Freeway Ramp Management Strategies | Pennsylvania DOT |
| 29 | Use of Fine Graded Asphalt Mixes Project 0-6615 | Texas DOT |
| 30 | Development of an Advanced Overlay Design System Incorporating Both Rutting and Reflection Cracking Requirements | Texas DOT |
| 31 | Retrofitting Culverts and Fish Passage-Phase II | Utah DOT |
| 32 | Examination of an implemented asphalt permeability specification | Virginia DOT |
| 33 | Analysis of Full-Depth Reclamation Trial Sections in Virginia | Virginia DOT |
| 34 | Investigation of the use of tear-off shingles in asphalt concrete | Virginia DOT |
| 35 | Recycling of Salt-Contaminated Storm Water Runoff for Brine Production | Virginia DOT |
| 36 | An assessment of the Virginia Department of Transportation’s Animal Carcass Disposal Practices and Guidance for the Selection of Alternative Carcass-Management Options | Virginia DOT |
| 37 | Geotechnical Data Management at the Virginia Department of Transportation | Virginia DOT |
| 38 | Performance of Virginia’s Warm-Mix Asphalt Trials | Virginia DOT |
| 39 | Field Comparison of the Installation and Cost of Placement of Epoxy-Coated and MMFX 2 Steel Deck Reinforcement: Establishing a Baseline for Future Deck Monitoring | Virginia DOT |
| 40 | Bituminous Surface Treatment Protocol | Washington DOT |
| 41 | Development and Application of Safety Performance Functions for Illinois | Illinois DOT |
| 42 | Development of Procedures for Determining the Axial Capacity of Drilled Shafts Founded in Illinois Shale | Illinois DOT |
Identified Methods to Determine Value of Research
Several methods were identified for determining the value of research (Figure 1). These methods were identified through content analysis of the documents provided to the research team as examples for quantifying research benefits. Methods for determining the value of transportation research are explained and exemplified here:
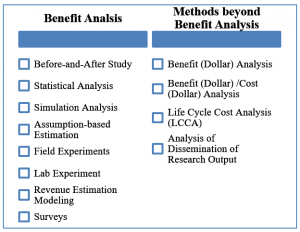
Benefit Analysis
Benefit analysis is a systematic approach for calculating the value of transportation research projects by determining the improvement in one or several areas. Benefit analysis uses this improvement as the basis to determine the value of research in transportation. For example, safety research projects aim to improve safety-related features of transportation systems, such as reduction in fatalities or accidents. Benefit analysis can be conducted using one of the following approaches within a specific area: before-and-after study, statistical analysis, simulation analysis, assumption-based estimation, experiments, lab experiments, revenue estimation modeling, and surveys.
Before-and-After Study
Before-and-after study has been used to compare conditions of transportation systems before and after a project is implemented to present the benefits of the research project sponsored by a transportation agency. The following examples show how this method has been used in various impact areas:
Safety. For instance, before-and-after study was used to determine safety benefits in the research project entitled “Improving Safety in High-Speed Work Zones: A Super 70 Study.” Super 70 was a construction project in 2007 on a heavily traveled interstate I-70 in the central area of Indianapolis. Indiana DOT applied several solutions including traffic management and enforcement countermeasures during the nine-month of construction to enhance safety. Indiana DOT sponsored this research project to determine the value of safety improvement. The overall change in safety in the work zone impact area was estimated using before-and-after study. The before-and-after study was conducted to estimate the safety change in terms of number of crashes on other roads in the I-70 work zone area before and after the work zone onset. Another example using before-and-after study to determine safety benefits is the research project entitled “Diverging Diamond Interchange Performance Evaluation (I-44 & Route 13) and Diverging Diamond Lessons Learned document.” Missouri DOT sponsored this project to conduct before-and-after analysis to compare pre-construction and post-construction crash conditions. This comparison enabled the Missouri DOT to evaluate the safety performance of the diverging diamond interchange.
Environmental Sustainability. For example, before and after study was used in the research project entitled “Evaluation of an Adaptive Traffic Signal System.” Missouri DOT sponsored this project to determine variations in vehicle emissions (HC, CO, and NOx) on the Route 291. Results showed a decrease of 50 percent in vehicle emissions through using traffic signal system.
Traffic and Congestion Reduction. For instance, in the research project entitled “Evaluation of an Adaptive Traffic Signal System,” before-and-after study was used to compare operational measures, such as travel time in morning off-peak and noon-peak period and change in average speed, recorded before the implementation of the system to the same measures recorded one month and five months after the implementation.
Statistical Analysis
Statistical analysis refers to methods, such as regression analysis, that provides a quantitative approach for the objective analysis of benefits based on historical data. The following examples show how this method has been used in various impact areas:
Safety. For example, in the Indiana Super 70 research project, logistic regression was used to estimate the impacts of individual safety countermeasures on the number of crashes.
Engineering Design Improvement. For example, the research project entitled “Calibration of Resistance Factors Needed in the LRFD Design of Driven Piles and Drilled Shafts” used statistical reliability analyses to calibrate the resistance factors for different design methods of axially loaded driven piles and drilled shafts needed in the LRFD design methodology. Researchers collected and evaluated drift shaft tests and used the statistical reliability analyses to calibrate the resistance factors of the different design methods. The results of this research showed that that local resistance factors were about 10 percent higher than those recommended by AASHTO.
Increased Service Life. For example, in the research project entitled “Evaluation of Life Expectancy of light-emitting diode (LED) Traffic Signals and Development of a Replacement Schedule,” rates of degradation were statistically analyzed using Analysis of Variance (ANOVA). The results showed that useful life of LED traffic signals meets or exceeds useful life warranty expectations.
Simulation Analysis
Simulation analysis is used to mimic the operation of a transportation network or a transportation system over time in order to calculate research benefits. Simulation requires developing proper models that represent key characteristics and behavior of a transportation system. The following examples show how this method has been used in various impact areas:
Safety. For instance, in the Indiana Super 70 research project, statistical models were used to forecast the number of expected crashes under certain traffic, weather, and geometry conditions. A sample of 156,646 30-minute intervals with 132 crashes reflecting the historical geometric, traffic, and weather conditions during the construction of Super 70 project was used to simulate safety effects.
Environmental Sustainability. For instance, mobility measures and emission outputs were calculated using simulation in the research project entitled “An Evaluation of the Benefits of the Alabama Service and Assistance Patrol” that was sponsored by the Alabama DOT.
Traffic and Congestion Reduction. For example, the research project entitled “An Evaluation of the Benefits of the Alabama Service and Assistance Patrol” used traffic simulation to estimate the overall delay in (delayed vehicle-hours). This simulation-based approach demonstrated that the reduction in delay to the traveling public is one of the major benefits of the Alabama Service and Assistance Patrol.
Engineering Design Improvement. For example, the research project entitled “Development of an Advanced Overlay Design System Incorporating Both Rutting and Reflection Cracking Requirements” developed a process that integrated the upgraded overlay tester into Texas DOT’s current mixture design system and developed an overlay thickness design methodology for Hot Mix Asphalt (HMA). This research project used simulation to test high-performance mixes and optimal thicknesses, particularly in the area of jointed flexible concrete pavements where joints must be repaired prior to placing any overlay. Results showed that it is possible to produce as minimum as 5 percent reduction in the use of asphalt mixes per year due to the improved performance of the overlays.
Assumption-Based Estimation
Assumption-based Estimation refers to the calculation of benefits through assumption-based estimations for key improvement features. The sources of assumptions can be experience, engineering judgment, and the literature. The following examples show how this method has been used in various impact areas:
Safety. For example, crash reduction rates (for the time period after the project is implemented) were drawn from the literature to estimate safety benefits in the project entitled “An Evaluation of the Benefits of the Alabama Service and Assistance Patrol.”
Environmental Sustainability. For example, emission rates were drawn from the literature to estimate environmental sustainability benefits in the project entitled “A Study of Bus Propulsion Technologies Applicable in Connecticut and Demonstration and Evaluation of Hybrid Diesel-Electric Transit.”
Improved Productivity and Work Efficiency. For example, in the project entitled “Geotechnical Data Management at the Virginia Department of Transportation,” it was assumed that on average, the use of this technology would cut in half the time required to gather and process borehole data, resulting in approximately 16 person-hours of savings.
System Reliability. For example, in the project entitled “A Study of Bus Propulsion Technologies Applicable in Connecticut and Demonstration and Evaluation of Hybrid Diesel-Electric Transit,” reliability of buses (after the project is implemented) was drawn from the literature and used to estimate reliability benefits.
Field Experiments
Field Experiments refer to experiments that examine the impact of research in the real world. The following examples show how this method has been used in various impact areas:
Safety. For example, in the project entitled “Development and Evaluation of Devices Designed to Minimize Deer-vehicle Collisions (Phase II),” field experiments were conducted to assess the behavioral responses of captive white-tailed deer to visual and physical barriers. These barriers were designed to minimize deer-vehicle collisions. In this research sponsored by the Georgia DOT, the impacts of exclusion fencing on free-ranging deer movement were also found.
Environmental Sustainability. For example, in the project entitled “Evaluation of Life Expectancy of LED Traffic Signals and Development of a Replacement Schedule,” field experiments were conducted to assess energy savings of LEDs. Field experiments were also utilized to assess the effect of the manufacturer, indicator type, color, and directional view on the degradation of LED traffic signals. This study, sponsored by the Missouri DOT, helped develop a replacement plan for the LEDs.
Improved Productivity and Work Efficiency. For example, in the project entitled “Development and Performance Assessment of an FRP Strengthened Balsa-Wood Bridge Deck for Accelerated Construction,” field experiments demonstrated that Fiber Reinforced Polymers (FRP) can accelerate the deck installation in half a day, which is faster than current practice.
Traffic and Congestion Reduction. For instance, the research project entitled “Mobile Work Zone Barrier” used field experiments to determine the impact of research on traffic and congestion reduction. The maintenance crew currently using the barrier found that it has eliminated approximately 15% of the lane closures previously required to perform necessary maintenance.
Customer Satisfaction. For instance, the research project entitled “An Evaluation of the Benefits of the Alabama Service and Assistance Patrol” used field data to evaluate services provided for customers. The program provided 17,090 assists from July 1, 2004 through June 30, 2005. This amount is equivalent to an average of approximately 66 assists per weekday.
Increased Service Life. For example, in the project entitled “Cost Effective Prevention of Reflective Cracking of Composite Pavement,” field experiments were used to compare different reflective cracking control treatments by evaluating the performance, constructability, and cost-effectiveness of pavements built with these treatments across the state of Louisiana. The Louisiana DOT sponsored this project to assess the performance of 50 different sites that were constructed with various treatments for evaluation periods ranging from 4 to 18 years. The results of this study indicated that saw and seal, and chip seal as a crack relief interlayer showed the most promising results in terms of performance and economic worthiness among various treatments.
Lab Experiments
Lab Experiments is used to assess impacts of transportation research projects on various areas under controlled conditions. The following examples show how this method has been used for quantifying the benefits in various impact areas:
Environmental Sustainability. For example, 46 lab tests were conducted at the University of Central Florida to examine how the amount of phosphorus can be reduced (the phosphorus is undesirable adjacent to bodies of water) in the research project entitled “Evaluation of Pollution Levels Due to the Use of Consumer Fertilizers under Florida Conditions.”
Increased Service Life. For example, in the research project entitled “Accelerated Loading Evaluation of Subbase Layers in Pavement Performance,” lab experiments were used to evaluate service life of subbase layers. The research results showed that clays with lime and silt combined with cement would create stronger foundations for pavement structure as compared to the raw natural soil. The stronger foundations eliminate the need for reconstruction of bases and pavement and result in longer service life.
Revenue Estimation Modeling
Revenue Estimation Modeling refers to modeling efforts that enable objective analysis of revenue benefits based on historical data. The following example shows how this method has been used for determining research value in the area of management and policy:
Management and Policy. For example, in the research project entitled “Assessment of the Impact of Future External Factors on Road Revenues,” a revenue forecasting model was developed to evaluate the implications of changes in several factors that have been shown to impact overall levels of transportation revenue. The model was developed as a “revenue estimation toolbox” to quickly evaluate how different scenarios could influence future fuel tax revenue in Georgia. This model was used to evaluate the reduction in the department’s revenues from electric and hybrid vehicles entering the fleet.
Surveys
Surveys refer to methods that are used to collect information from a random sample of a certain population. The following example shows how this method has been used for determining value of research in the area of customer satisfaction:
Customer Satisfaction. For example, in the research project entitled “Diverging Diamond Interchange Performance Evaluation (I-44 & Route 13) and Diverging Diamond Lessons Learned document,” survey was used to collect public perception about the project. Missouri DOT sponsored this project to collect the public perceptions from general public, pedestrians, bikers, and driver of larger vehicles, such as truck drivers. The survey results showed that more than 80% of respondents expressed that traffic flow had improved and traffic delay had decreased. 87% of respondents expressed that crash was more likely to occur within a standard diamond when compared to a Diverging Diamond Interchange (DDI). About 80% of respondents expressed that larger vehicles and pedestrian/bike movements through the DDI were better or similar to a standard diamond interchange. More than 90% of respondents expressed good understanding on how the interchange operated with the current design of islands, signing, signals, and pavement markings.
Methods beyond Benefit Analysis
Benefit (Dollar) Analysis
Benefit (Dollar) analysis goes beyond benefit analysis by presenting the value of transportation research in dollar values. The following examples show how this method has been used for determining research value in different impact areas:
Safety. Reduction of fatalities, crashes, and injuries (three common measures of safety improvement) are often calculated in dollar terms. For instance, the expected change in the number of crashes was estimated in the FHWA research project entitled “Rural Road Low Cost Safety Improvements.” The estimated crash costs were then applied to the expected change in crashes to estimate the annual dollar savings resulted from the improvements. Crash costs typically vary by States but can be estimated from the FHWA crash cost guide when State-specific crash cost data are not available (Council et al. 2005).
Environmental Sustainability. For example, it was shown in the research project entitled “Evaluation of Life Expectancy of LED Traffic Signals and Development of a Replacement Schedule” that an annual energy saving of $120.75 can be realized if one unit of LED is installed. A 10-year life span and an average electric cost of $0.1/kWh were applied in this analysis.
Improved Productivity and Work Efficiency. For example, in the research project entitled “Geotechnical Data Management at the Virginia Department of Transportation,” it was conservatively estimated that the labor-cost savings would be approximately $600 for each average small- to mid-size bridge project. The Virginia DOT had been approving an average of 102 bridges per year for construction for 15 years. Therefore, the potential cost savings were estimated to be in the order of $160,000 per year.
Traffic and Congestion Reduction. For example, in the research project entitled “Mobile Work Zone Barrier,” it was estimated that the number of avoided lane closures equated to a potential annual savings of $115,464,000 in public user road costs due to reduced travel delay.
Reduced Construction, Operation, and Maintenance Costs. For example, in the research project entitled “Evaluation of Ternary Cementitious Combinations,” it was shown that cement mixtures containing up to 70 percent fly ash and slag exhibited concrete test results that were comparable (or better) than those obtained from control mixtures containing no supplemental cementitious materials. This research indicated potential material cost savings around $25,000 per lane-mile when replacing 70 percent Portland cement with fly ash and slag.
Engineering Design Improvement. For example, the research project entitled “Development and Evaluation of Devices Designed to Minimize Deer-vehicle Collisions (Phase II)” found that the overall cost of the outrigger design installation was 20% less than the standard 2.4 woven-wire design installation ($3,200/mile).
Increased Service Life. For example, in the research project entitled “Cost Effective Prevention of Reflective Cracking of Composite Pavement,” benefit (Dollar) analysis revealed that saw and seal was cost-effective in comparison with regular Hot Mix Asphalt (HMA) overlays in 80 percent of sections under study. This analysis also showed that chip seal was cost-effective in comparison with regular HMA overlays in 75 percent of sections under study. Cost data for the high strain reflective crack relief interlayer and HMA overlays were obtained from actual bid items for each project.
Benefit (Dollar)/Cost (Dollar) Analysis
Benefit (Dollar)/Cost (Dollar) analysis (B/C analysis) goes beyond benefit analysis and calculates and compares benefits and costs of research projects in terms of dollar values. The following examples show how this method has been used for determining benefits in various impact areas:
Safety. For example, benefit (Dollar)/cost (Dollar) analysis was utilized in the North Carolina research project entitled “Placement of Detection Loops on High Speed Approaches to Traffic Signals” to evaluate cost effectiveness of alternatives to assess various systems. An estimated 10 percent reduction of crashes was assumed to be achieved due to the installation of the technologies. Crash data for years 2006, 2007, and 2008 were collected from the North Carolina DOT. The average number of crashes was used for calculating benefits. The equivalent unit crash cost was drawn for each county from the North Carolina DOT Traffic Engineering and Safety Systems branch website. This cost was considered as the project benefit in terms of dollars and was compared with the cost of installation of various systems, such as Detector-Control System (D-CS) and NQ4 system.
Improved Productivity and Work Efficiency. For example, the research project entitled “Winter Operations GPS/AVL” assessed the expected benefits and costs of an integrated (Geographic Positioning System and Automatic Vehicle Location (GPS/AVL) system. The benefits of the Winter Operations GPS/AVL system were calculated in terms of reducing paperwork costs and operating costs. Both initial and annual operating and maintenance costs were also calculated in dollar values. The ratio of benefits to costs was used as an indicator for determining the value of this research project.
Traffic and Congestion Reduction. For instance, the research project entitled “Placement of Detection Loops on High Speed Approaches to Traffic Signals” found that well-placed detectors and a carefully chosen signal timing strategy reduced the likelihood that vehicles would be caught in dilemma zones at the onset of yellow. The research project calculated dollar values of both benefits (reduction in delay) and system costs. It was found that the Detector-Control System (D-CS) system produced benefit-cost ratios significantly greater than 1.0.
Reduced Construction, Operation, and Maintenance Costs. For instance, the research project entitled “Winter Operations Geographic Positioning Systems and Automatic Vehicle Location” studied the benefits and expected costs of an integrated Geographic Positioning System and Automatic Vehicle Location (GPS/AVL) system. The research project calculated dollar values of both benefits in terms of reduced material costs, reduced labor costs, reduced equipment costs, and reduced paperwork, and compared the benefits against the system costs. It was found that the system produced benefit-cost ratio of 17.3.
Customer Satisfaction. For instance, the research project entitled “An Evaluation of the Benefits of the Alabama Service and Assistance Patrol” studied the benefits and expected costs of the Alabama Service and Assistance Patrol. Estimation drawn from the literature (GDOT 2006; Hawkins 1993) was used as the value of customer service per assist. Based on these studies, a range of values from $30 to $60 per assist was used, with the midpoint of $45 assumed to be the most likely value. When applied to 17,090 assists recorded by the Alabama Service and Assistance Patrol (A.S.A.P.) during the study year, the low-end estimate for the economic value of customer service benefits became $512,700, the high-end estimate was $1,025,400, and the most likely value was $769,050. Number of assists and program costs were provided by “Third Division office of the Alabama Department of Transportation.” The recorded cost of providing these services was $592,243 from July 1, 2004 through June 30, 2005. The cost information, provided by the Third Division office of Alabama DOT, included (a) capital costs, such as new equipment; and (b) operations and maintenance costs, such as personnel salaries and associated benefits.
Reduced Administrative Costs. For instance, the research project entitled “Winter Operations Geographic Positioning Systems and Automatic Vehicle Location” studied the benefits and expected costs of an integrated GPS/AVL system. The research project calculated dollar values of both reduction in administrative costs (realized through reduced paperwork) and system costs.
Life Cycle Cost Analysis (LCCA)
Life Cycle Cost Analysis evaluates costs in various areas of research associated with all the stages of a transportation system’s lifecycle. The following examples show how this method has been used for various impact areas:
Reduced Construction, Operation, and Maintenance Costs. For example, the project entitled “Analysis of Full-Depth Reclamation Trial Sections in Virginia” compared a traditional pavement rehabilitation program (based on partial- and full-depth mill and replacement) with one that incorporated full-depth reclamation (FDR) using a LCCA approach. The present costs of the traditional pavement rehabilitation approach were multiplied by the total area of the potential FDR sites. The cost over a 50-year life cycle was calculated as $60.95 million. It was estimated that the Virginia DOT could save approximately $10 million over a 50-year period by implementing an FDR program for those flexible pavements identified on the primary network.
Increased Service Life. For example, the project entitled “Accelerated Loading Evaluation of Subbase Layers in Pavement Performance” used LCCA to determine value of research. The research objective of this project was to explore and develop a methodology to build reliable subgrade layers stabilized with cementitious agents at various field moisture contents. The research results showed that clays with lime and silts combined with cement would create stronger foundations for pavement structure as compared to the raw natural soil. LCCA results showed that subbase in place of a lime-treated working table layer would create 37 percent annualized cost savings for low-volume and 31 percent cost savings for high volume pavement structures in Louisiana using 12-in. cement stabilized soil.
Analysis of Dissemination of research output
Analysis of dissemination of research outputs refers to the investigation of penetration of research outputs, such as guidelines, tools, and software pieces, in the research and practice communities. The following examples show how this method has been used for various impact areas:
Intelligent Transportation Systems. For example, in the project entitled “Systems Engineering Guidebook,” the dissemination of the research output into the research and practice communities was measured. The statistics on acquisition during the first 2 years (2007 to 2009) of operation were used to attest to the usefulness of the System Engineering Guide Book (SEGB).
Identified Measures to Determine Value of Research
Table 3 summarizes the identified measures used for determining the value of research. These measures were identified through content analysis of the documents recommended by transportation research managers as best examples for quantifying research benefits.
Various measures were identified for determining the value of research in different areas of benefits. The identified measures were critically analyzed and then, categorized for each area of benefit. After analyzing the identified categories of measures, it is concluded that there is a common structure that can be adopted to place the identified measures (i.e., metrics). The following two categories provide a common structure for classifying the identified research measures across different areas of benefits:
- Benefit Measures: For instance, “An Evaluation of the Benefits of the Alabama Service and Assistance Patrol” research project used the reduction in occurrence rate of secondary crashes to determine the value of safety research (Turochy et al. 2009).
- Cost saving measures: For instance, “An Evaluation of the Benefits of the Alabama Service and Assistance Patrol” research project used dollar benefits of the reduction in occurrence rate of secondary crashes to determining the value of safety research (Turochy et al. 2009).
The identified measures were organized based on areas of benefit that the transportation research has made an impact on, such as Safety. In fact, impact area has been an important factor for selecting the measures for determining the value of research. For example, only cost-saving measures have been used to determine the value of research in two areas of benefits (i.e., reduced construction, operations and maintenance (O&M) costs and reduced administrative cost) due to the inherent characteristics of these areas. In contrary, the value of research in the area of system reliability has not been determined using the cost-saving measures.
| Table 3: Summary of the identified measures for different areas of benefits. | ||
| Areas of Benefit | Benefit Measures | Cost Saving Measures |
| Safety | – Number of crashes (fatal, injury, or property damage) saved.
– Lateral separation between the motor vehicle and bicyclist. – Motor vehicle outside through lane usage. – Motor vehicle speeds before, during and after passing bicyclist. – Number of stops reduction. |
– Dollar benefits of reduction in crashes. |
| Environmental Sustainability | – Reduction in emission outputs (e.g., HC, CO2, CO, NOx).
– Fuel consumption saving. – Energy savings due to use of LEDs. – Amount of reuse of the storm water runoffs. |
– Reduction in emission outputs (HC, CO, CO2, and NOx) and anticipated fines.
– Disposal cost savings by recycling of salt-contaminated storm water. – Cost savings due to use of LEDs. |
| Improved Productivity and Work Efficiency | – Reduction in time of set-up and breakdown of a lane closure.
– Reduction in percentage of lane closures. – Time saving. – Productivity improvement. |
– Reduction in percentage of lane closures.
– Reduced material costs. – Reduced labor costs. – Reduced equipment costs, and paperwork. – Cost savings due to time savings. |
| Traffic and Congestion Reduction | – Reduction in percentage of lane closures.
– Travel time reduction and average annual traffic. – Reduction in navigation errors and light violation. – Reduction in intersection delay and number of stops. |
– Motorists savings due to reduction in delays, reduction in percentage of lane closures, reduction in intersection delay and number of stops |
| Reduced Construction, O&M Costs | – Energy savings and reduction in amount of annual fertilizer.
– Reduced material costs, labor costs, equipment costs, and paperwork costs. – Disposal savings by recycling of salt-contaminated storm water, reuse of the storm water runoff. – Pavement rehabilitation savings. – Construction and rehabilitation cost savings. |
|
| Management and Policy | – Revenue level | |
| Customer Satisfaction | – Number of services provided to motorists
– Enhanced public perceptions. |
|
| System Reliability | – Comparative reliability in percentage.
– Average mean distance between failures. |
|
| Engineering Design Improvement | – Reduction in daily deer movements in response to fencing.
– Increased flexibility. – Reduction in the use of asphalt mixes. |
|
| Increased Service Life | – Increased Service Life. | – Cost of pavement rehabilitation. |
| Reduced Admin. Cost | – Reduced paperwork savings. | |
Validation
Several subject matter experts, who were research program managers of transportation agencies, rated the results highly useful. Minor recommendations were offered to enhance the quality of the research. For instance, several documents were introduced to the research team for consideration as potential sources for identifying methods and measures that can be utilized in finding the value of research projects.
Subject matter experts highlighted flexibility as the key for determining the value of research. The results of this research do not recommend enforcing a single method for determining the value of research. In contrary, it assists managers of research programs in a transportation agency to determine the value of research by providing them with exemplary valuation cases identified by subject matter experts in research programs from other agencies. In addition to flexibility, the subject matter experts and survey respondents provided other valuable comments that highlight the importance of this research and provide a roadmap for any future attempt to develop guideline to determine value of research:
- There is not a formal guideline for assessing benefits of research reports.
- Evaluation methodology for determining value of research should be simple.
- Developing training programs for researchers and DOT personnel is vital.
- Communication of research benefits is important.
- Data scarcity for evaluation of research benefits is a significant challenge.
Conclusion
The results of the survey showed 80% of respondents have not conducted any study regarding the value of research. Although most responding State DOTs (84%) have future/present plans to quantify the value of research projects, the lack of knowledge about existing methods and measures is a significant barrier for assessing the benefits of research projects across various benefit areas. The respondents commented that collection and distribution of good evaluation examples are extremely helpful. Recommended by the survey respondents, a total of 42 documents were analyzed as best examples for determining the value of research. The collected documents were in the form of valuation of DOT research projects that were identified by subject matter experts. These exemplary documents were reviewed and their contents were analyzed. The results of content analysis showed that regardless of all the differences in the benefit areas, all the managers of transportation research agencies answer two common critical questions about the value quantification methods and measures when it comes to determine value of research. This research shows how research program managers in transportation agencies answer these two critical questions. The results were presented to subject matter experts for validation. These subject matter experts rated the results highly useful to their practices as research program managers of transportation agencies.
Several methods (i.e., benefit analysis, benefit dollar analysis, benefit dollar / cost dollar analysis, life cycle cost analysis, analysis of dissemination of research output) have been utilized by transportation agencies to determine the value of research under various identified impact areas, such as safety, environmental sustainability, productivity and work efficiency, traffic and congestion reduction, and reduced construction, operations and maintenance costs. Benefit analysis has typically been the most frequently used method to determine the value of research projects. Benefit analysis method can be further broken down to the following approaches within a specific area: before-and-after study, statistical analysis, simulation analysis, assumption-based estimation, experiments, lab experiments, revenue estimation modeling, and surveys. Various measures were also identified for determining value of research in different areas of benefits. These measures were categorized for each area of benefit. The major contribution of this paper is to identify and exemplify various methods and measures that have been successfully used for determining value of transportation research in a variety of impact areas.
Acknowledgments
This material is based upon work supported by the Southeast Transportation Consortium (STC) and the Louisiana Transportation Research Center (LTRC).
References
| [1] | Anderson, D.I. (2010). Measuring the Benefits of Transportation Research in Utah. Prepared for Utah Department of Transportation Research Division, Final Report, No. UT-10.01. |
| [2] | Ardis, C.V. (1988). Evaluation of ODOT Research and Development Implementation Effectiveness. Final Report, Prepared for Ohio Department of Transportation, No. FHWA/OH-89/002. |
| [3] | Concas, S., Reich, S. L., and Yelds, A. T. (2002). Valuing the Benefits of Transportation Research: A Matrix Approach. Final Report, No. 2117-463L0. |
| [4] | Council, F., Zaloshnja, E., Miller, T., and Persaud, B. N. (2005). Crash cost estimates by maximum police-reported injury severity within selected crash geometries. Final Report. No. FHWA-HRT-05-051. |
| [5] | Ellis Jr, R. D., Degner, J., O’Brien, W., and Peasley, G. (2003). Review, Analyze and Develop Benefit Cost/return on Investment Equations. Guidelines and Variables, No. UF Proj. 4910 45-04-835. |
| [6] | Georgia Department of Transportation (2006). BenefitAnalysis for the Georgia Department of Transportation NaviGAtor Program. Project No. NH-7713-00(010), August, 2006. |
| [7] | Hamilton, Michael Braun (2009). Online survey response rates and times. Ipathia Inc./SuperSurvey. |
| [8] | Hawkins (1993). Evaluation of the South West Freeway Motorist Assistance Program in Houston. Report No. TX-94/1922-IF, Texas Transportation Institute, College Station, Texas, 1993. |
| [9] | Krugler, P., Walden, M. N., Hoover, B., Lin, Y. Y. D., & Tucker, S. (2006). Performance Measurement Tool Box and Reporting System for Research Programs and Projects. NCHRP, 127, 20-63. |
| [10] | MAP-21 (2012), Moving Ahead for Progress in the 21st Century. http://www.gpo.gov/fdsys/pkg/CRPT-112hrpt557/pdf/CRPT-112hrpt557.pdf, last visited: 5/25/2015. |
| [11] | NSF (2017), Federal R&D Funding, by Budget Function: Fiscal Years 2015–17. Source: https://www.nsf.gov/statistics/2017/nsf17305/pdf/nsf17305.pdf, last visited: 2/19/2017. |
| [12] | Nulty, D.D. (2008), The adequacy of response rates to online and paper surveys: what can be done? Assessment and Evaluation in Higher Education, Vol. 33, No. 3, June, 301-314. |
| [13] | Tavakoli, A., Collyard, C. S. (1991). Benefit-cost analysis of transportation research projects. Ohio DOT. |
| [14] | TRB Research Pays off (2015), Transportation Research Board Research Pays off Website. http://www.trb.org/Publications/RPObySubjectAreas.aspx, last visited: 5/25/2015. |
| [15] | Turochy, R. E., & Jones, S. L. (2009). An Evaluation of the Benefits of the Alabama Service and Assistance Patrol (No. Project 930-635). Highway Research Center, Auburn University. |
| [16] | Worel, B. J., Jensen, M., and Clyne, T. R. (2008). Economic benefits resulting from road research performed at MnROAD. Third International Conference on Accelerated Pavement Testing, October 1-3, 2008, Madrid, Spain. |